Tracking Covid-19 in Connecticut
Summary of Daily Connecticut Report
June 22, 2020
Latest Connecticut Data from the Department of Public Health
| Latest Data on Covid-19 in Connecticut | |||
|---|---|---|---|
| Data as of April 28, 2021 | |||
| total to date |
since yesterday |
since a week ago |
|
| Cases | 338,447 | +486 | +4,715 |
| Deaths | 8,084 | +4 | +45 |
| Currently in Hospital | 403 | -4 | -112 |
| Tests | 8,619,938 | +36,200 | +192,199 |
| Rate of positive tests | 1.2% | 2% | |
| Nursing home cases1 | 8,672 | +3 | |
| Nursing home deaths | 2,719 | +72 | |
| Source: Multiple tables from Connecticut Open Data | |||
|
1
Nursing home data are reported only weekly so the dates for "today" and a "week ago" are 06/19/2020 and 06/11/2020.
|
|||
There is a new data tracker map that displays the rate of cases in the last two weeks by town. It is color-coded to indicate where cases are most prevalent.
My post on Covid-19 back in March tracked the growth of the epidemic as it hit Connecticut. Back at the end of March I did not realize that the greater New York area (including Connecticut) would be the center of the first wave in the US. At that time what I was reading focused on the nature of exponential growth of an epidemic. We were urged to “flatten the curve” and that shaped the way I presented the data in that post. I have been updating the figures in that post each evening. During that time the Connecticut data portal has expanded considerably, and I’ve built some R code that let’s me easily update that post. I’ll use the same data infrastructure for this post as well. This post is more oriented toward tracking the current status of the epidemic in Connecticut.
Tracking the Virus in Connecticut
This post focuses on what is happening currently. The aim is to use the recent trend to get some idea of the near future. The first plot will show the average number of new cases reported each day along with a line that displays the rolling seven-day average. Typically there are day-of-the-week effects in the reporting so it’s best to focus on the seven-day average.
New Covid-19 Cases in Connecticut
The plot shows the history of new cases and also shows the actions
required by some of Governor Lamont’s executive orders.
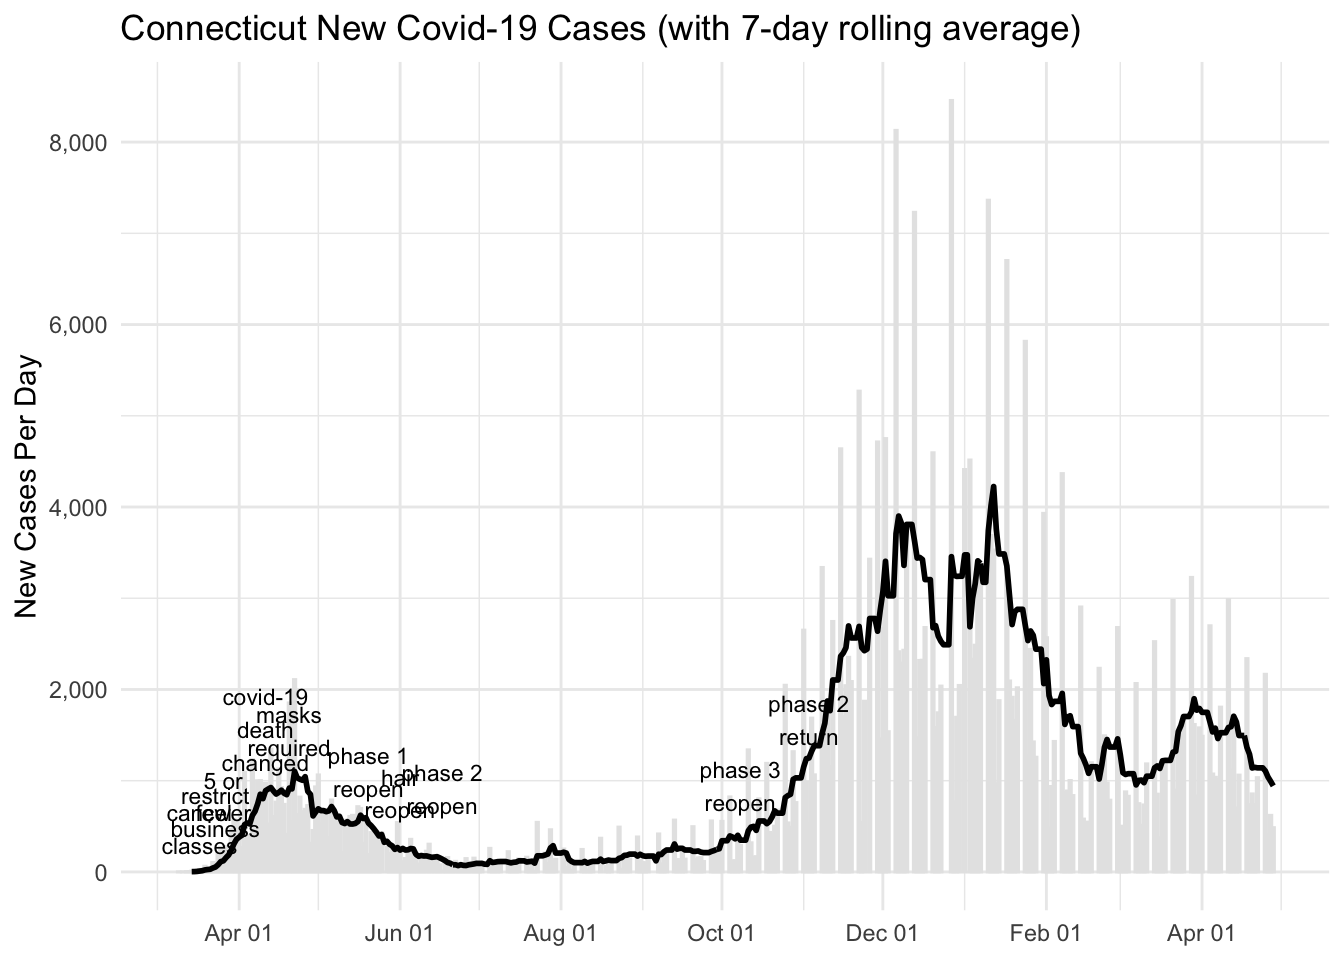
Figure 1: New Cases
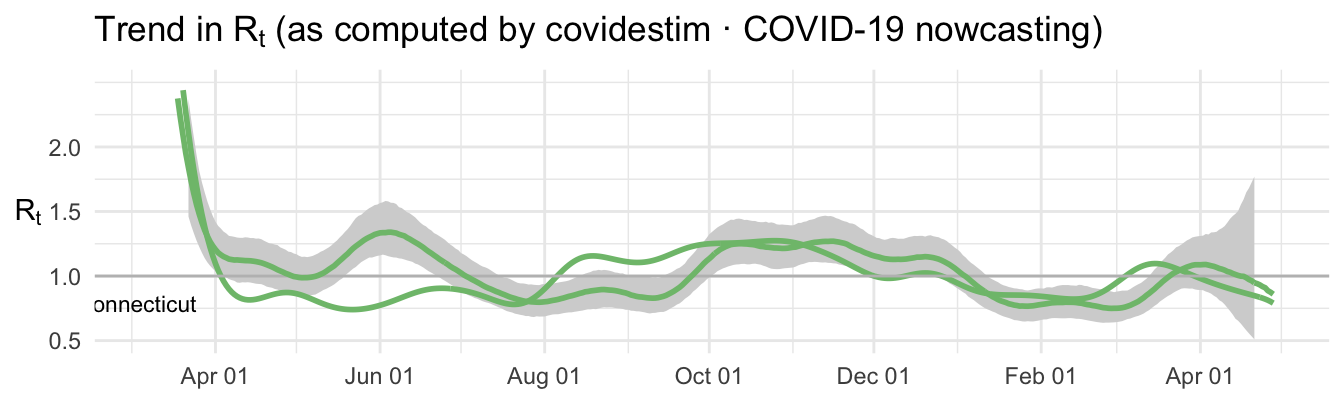
Figure 2: Estimated Rt
Covid-19 Deaths in Connecticut
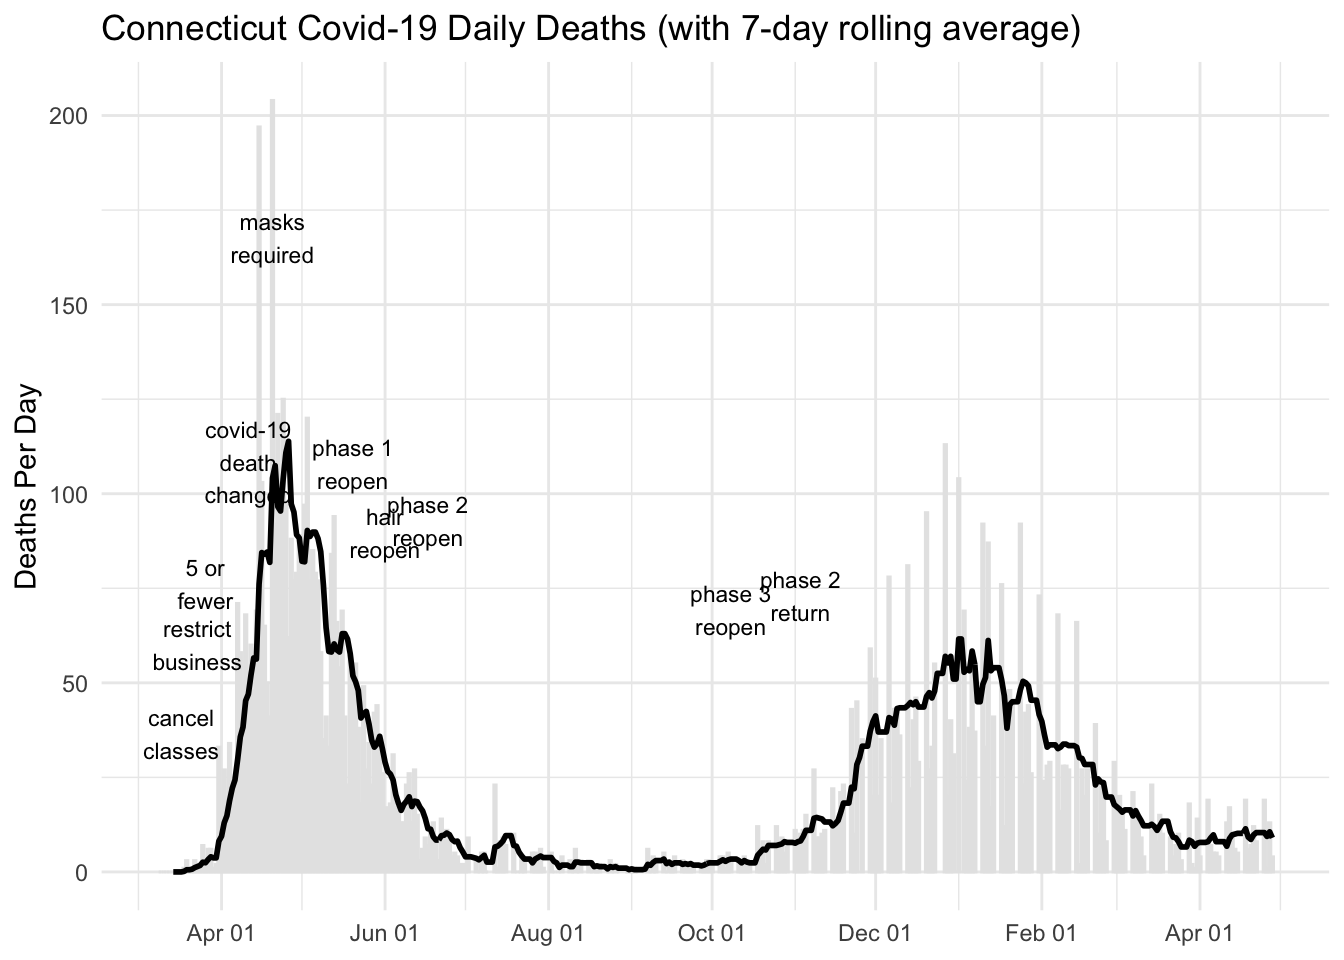
Figure 3: Daily Deaths
Connecticut Covid-19 Patients in Hospital
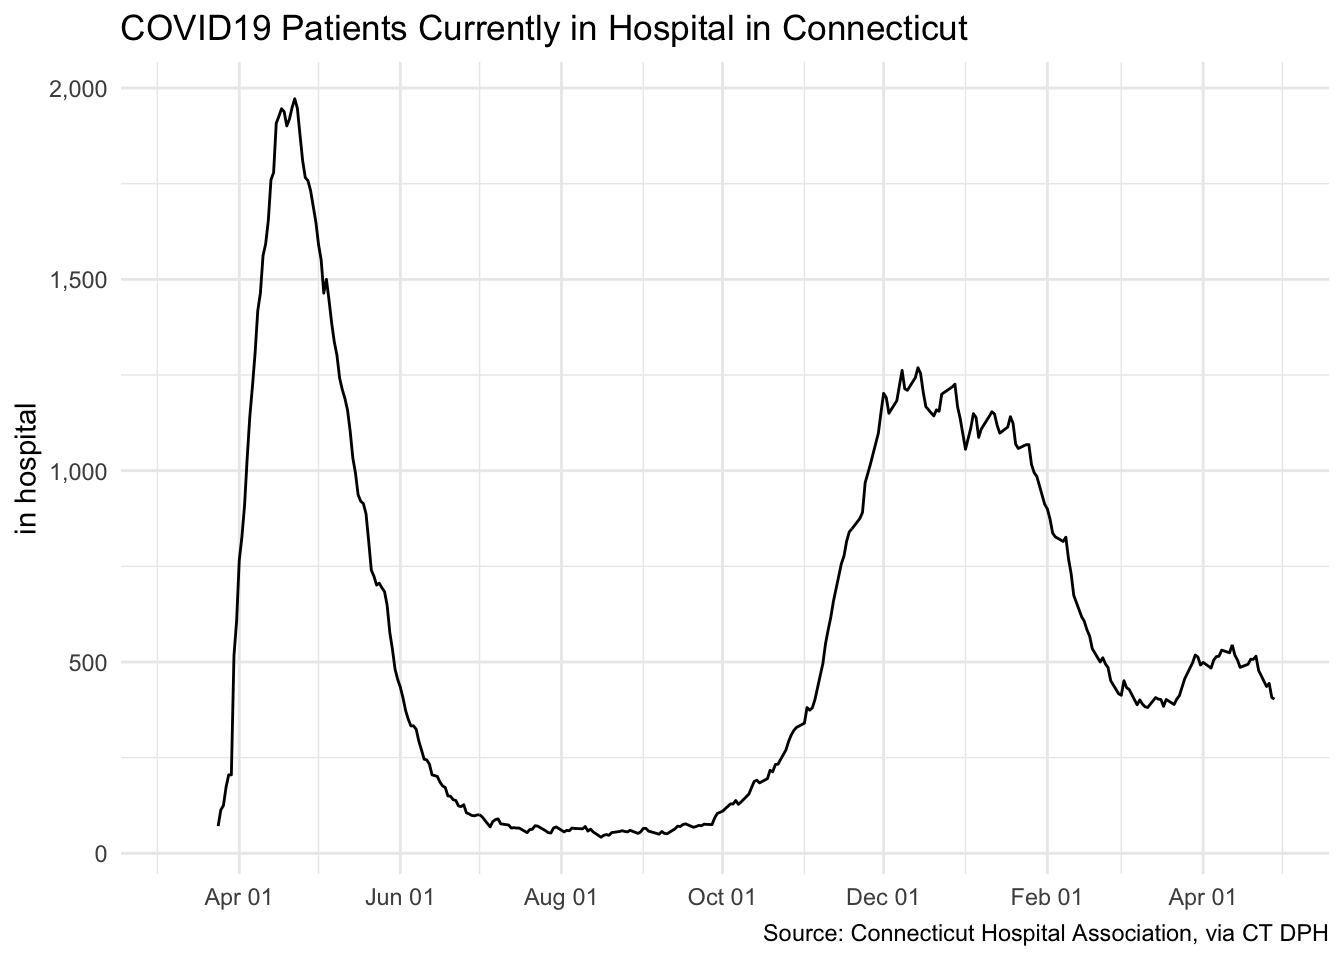
Figure 4: Covid-19 Patients in Hospital
The number of new cases peaked in mid April and then began to
decrease rapidly, although not as rapidly as it increased. A key issue
is how fast epidemic is expanding or contracting. One indicator of that
is to estimate the parameter Rt, the average number of people
who become infected by an infectious person. When Rt is
greater than 1 the number of daily new cases is increasing, If
Rt is less than 1, it is decreasing. See the site
covidestim · COVID-19 nowcasting for an estimate by state of the effective
value for Rt. The site is described in this
article
at Vox.com. I don’t claim to have the expertise to evaluate the quality
of the calculation of R at the covidestim site, but it
seems to jive with other information about the pattern of the epidemic
among states.
As of June (and a month previous), Connecticut, New York, and New Jersey have among the lowest values for Rt in the country. This is good news for us in Connecticut. I have included Rt for Arizona as well as Connecticut to provide a contrast with a state that has lately shown signs of a growing outbreak. The goal in Connecticut and in the entire New York City area is to keep Rt well under 1. As of 04/28/2021 Rt is 0.79. On the other hand, in Arizona Rt is about 0.86.
Comparisons with Other States
Estimate of Rt by State (from covidestim · COVID-19 nowcasting)
The next display shows the trend of Rt in each state arranged
according to geographic position in the US. Remember that Rt
is a measure of the rate of increase. When Rt is greater than
1 the number of daily new cases is increasing, If Rt is less
than 1, it is decreasing. The color of the R line shows whether the most
recent estimate of R for a state is above 1 (purple
line) or equal or below 1 (green
line).
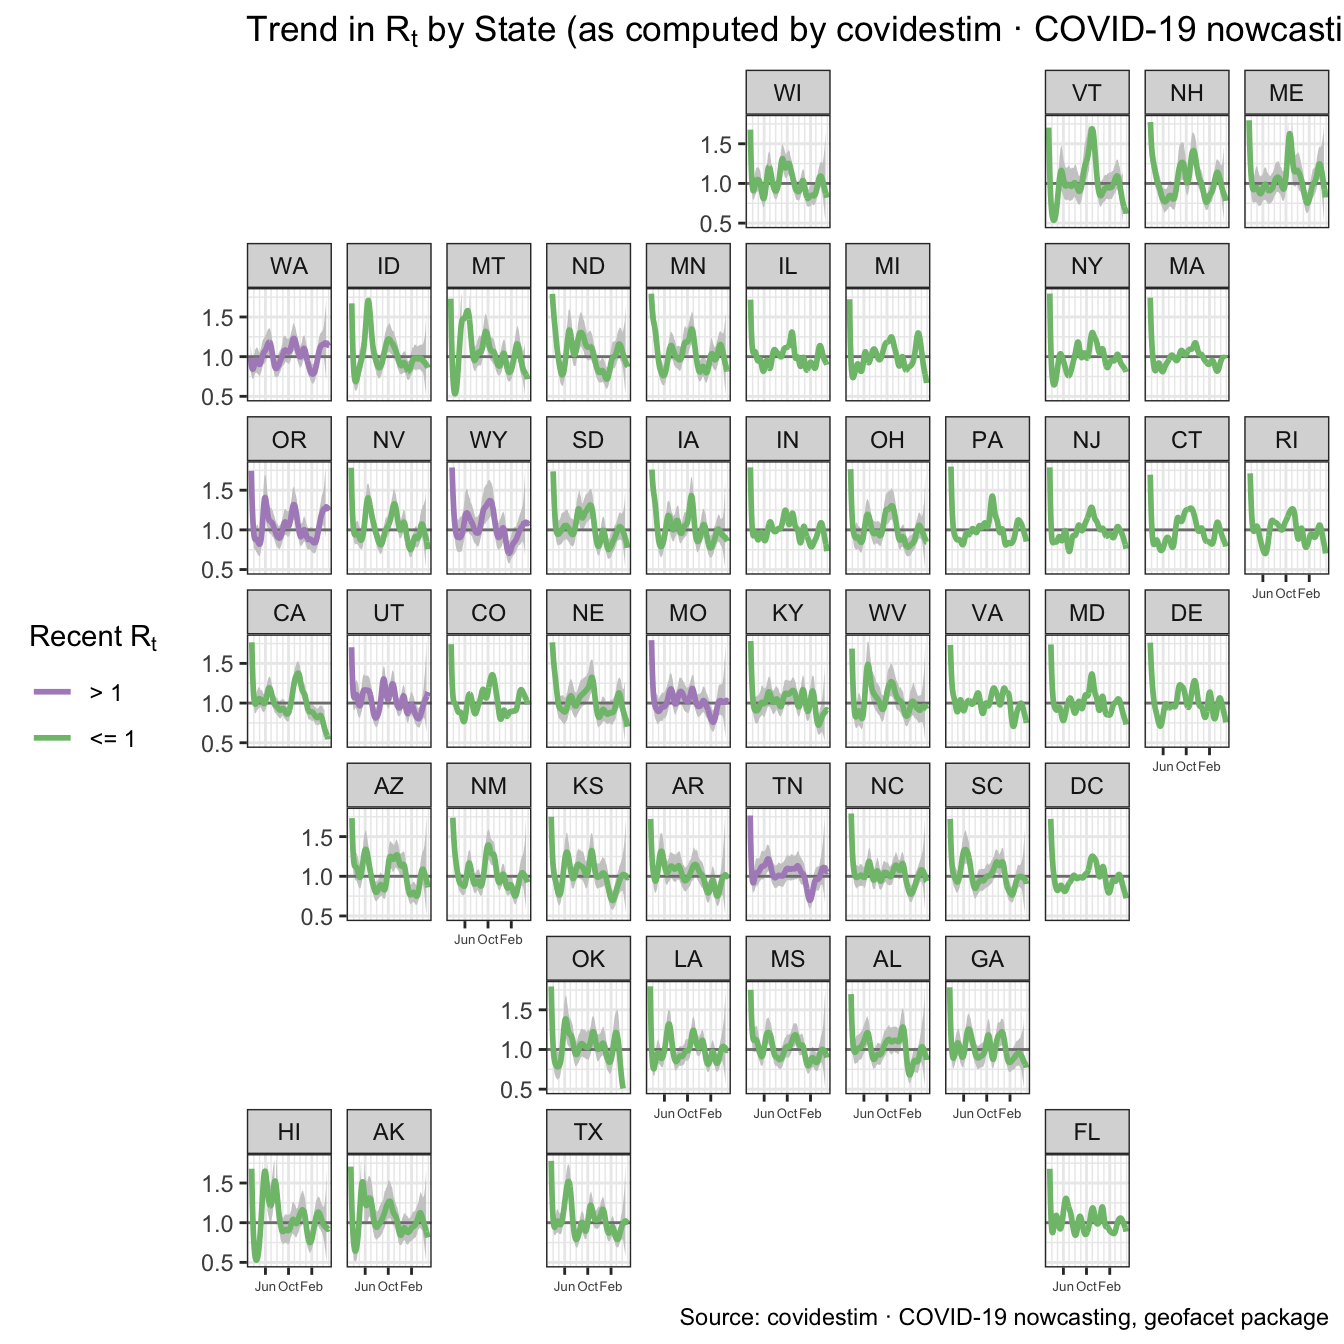
Figure 5: Estimate of Rt by State
R is estimated from the state data and the gray area around the
line indicates the statistical uncertainty of the estimate showing an
95% confidence interval. Note that this map shows only whether
transmission seems to be growing or shrinking. How concerned one should
be about the epidemic in a particular state also depends on the
prevalence of cases.
Trends in New Cases by State
The next map shows the history of new cases in each state per 100K of
population. The lines are color coded the same as in the previous map to
indicate whether the most recent estimate of R for a state is above 1
(purple line) or equal or below 1 (green
line).
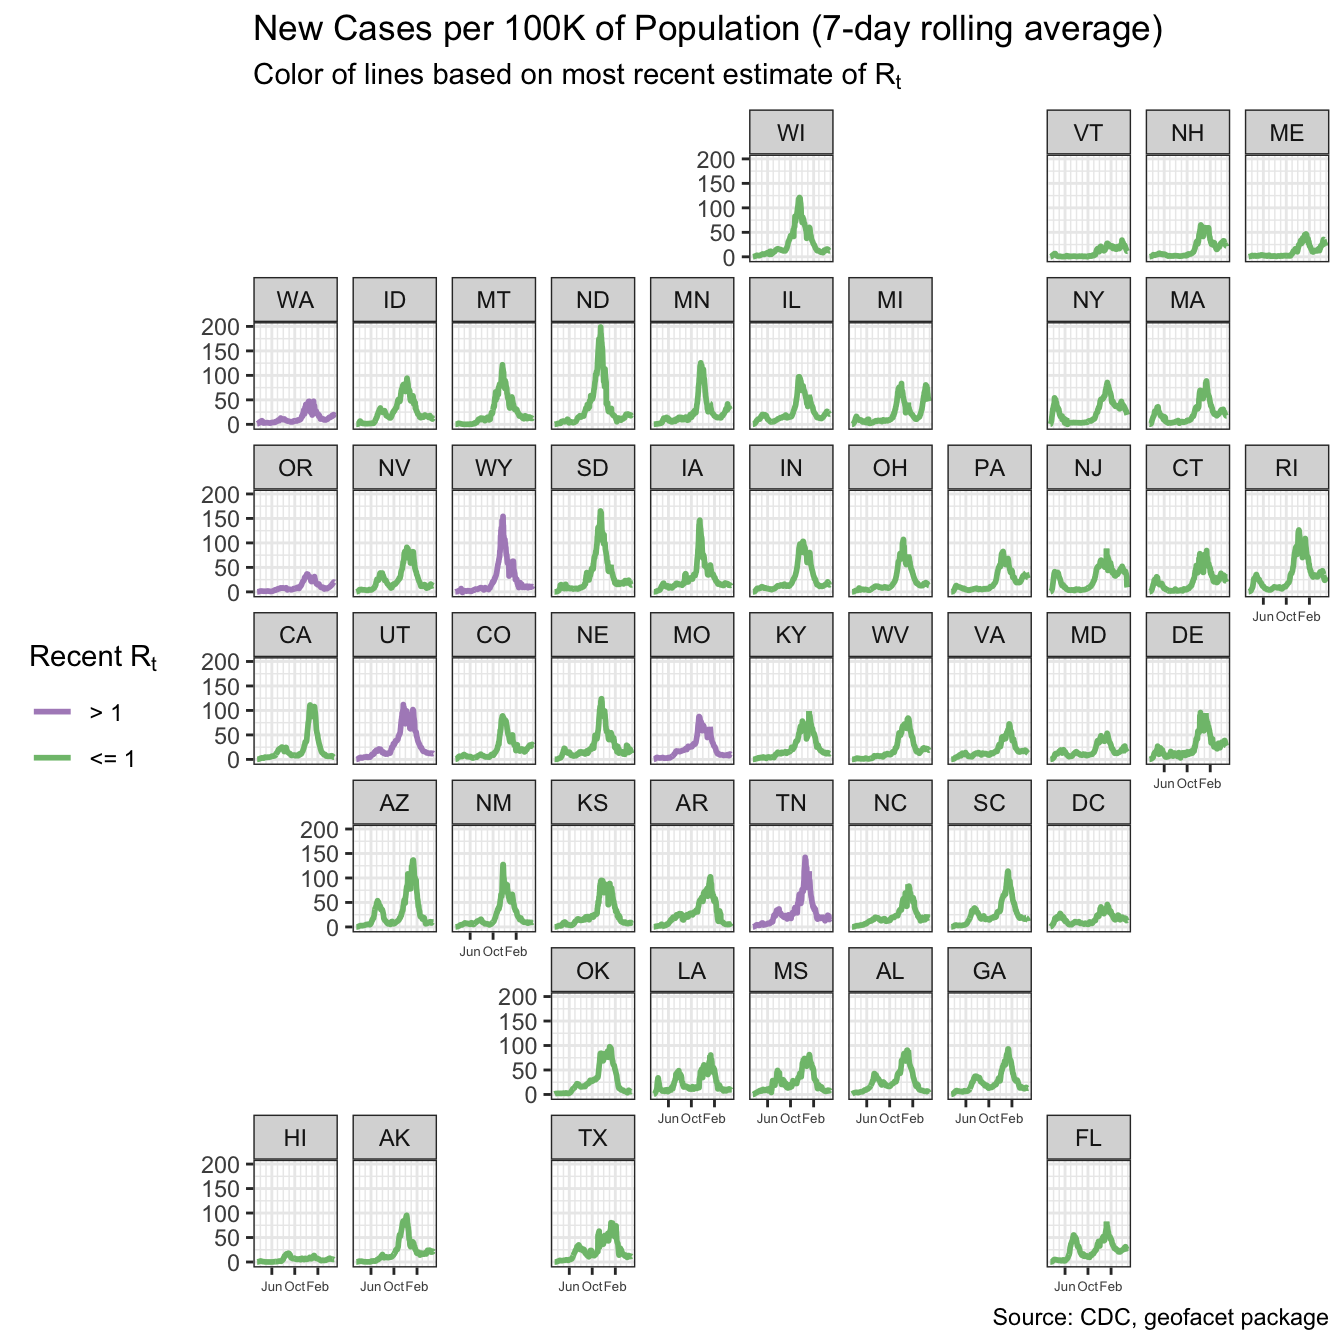
Figure 6: New Cases per 100K by State
The tallest graphs of new cases per 100K of population are New
York and Arizona.. From the point of view of someone living in
Connecticut, the striking thing is how thoroughly Connecticut (and New
York, New Jersey, Rhode Island, and Massachusetts) have recovered from
the peak. New cases are low and the low value of the estimate of R
confirms that they are likely to decrease even more. The great contrast
is with the increase of cases in some of the southern states.
Connecticut Covid-19 Deaths and Cases by Age
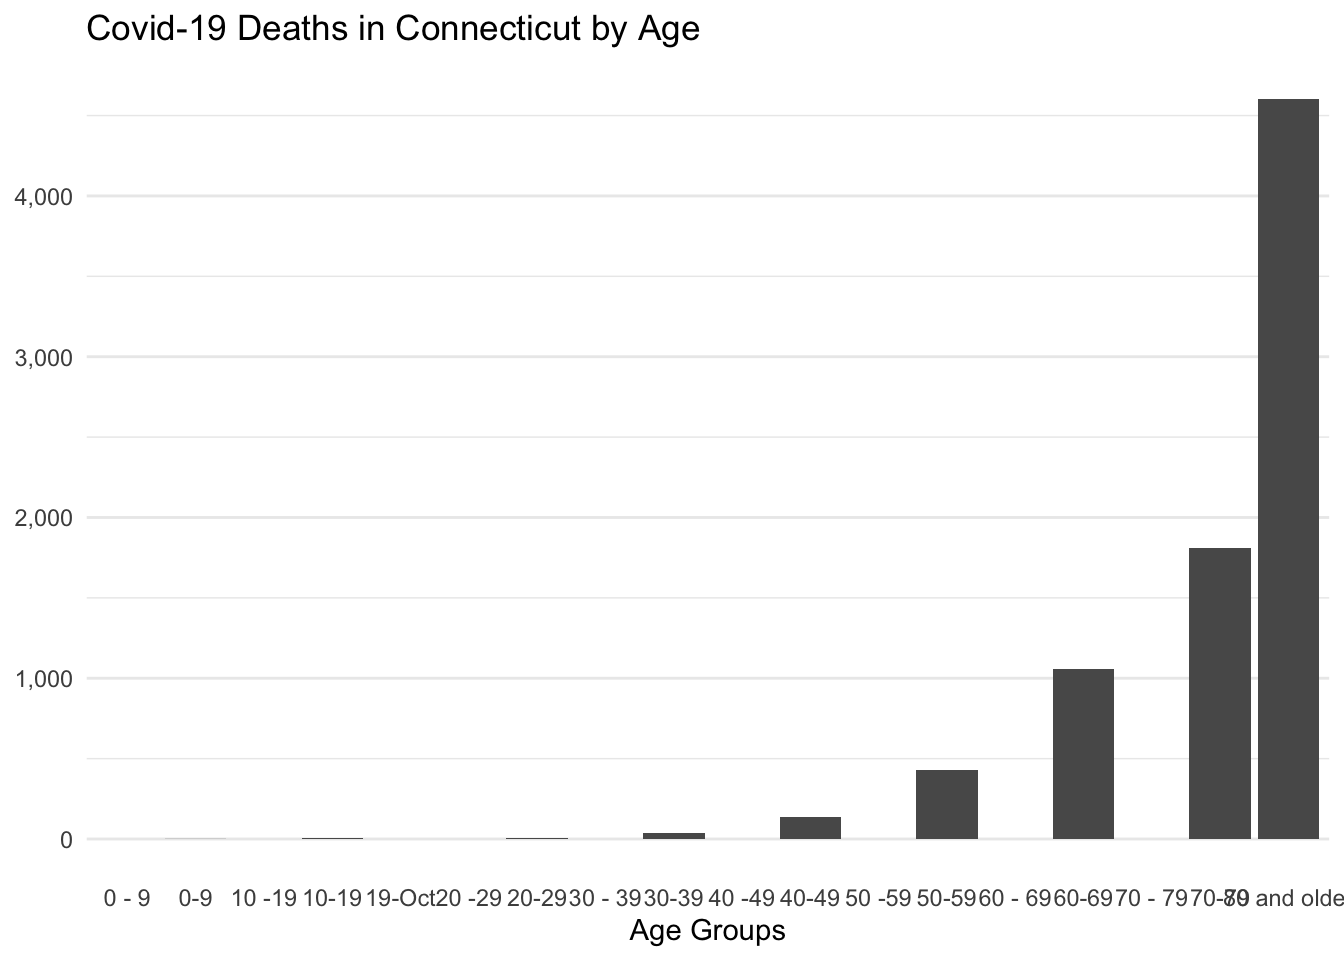
Figure 7: Covid-19 Deaths by Age
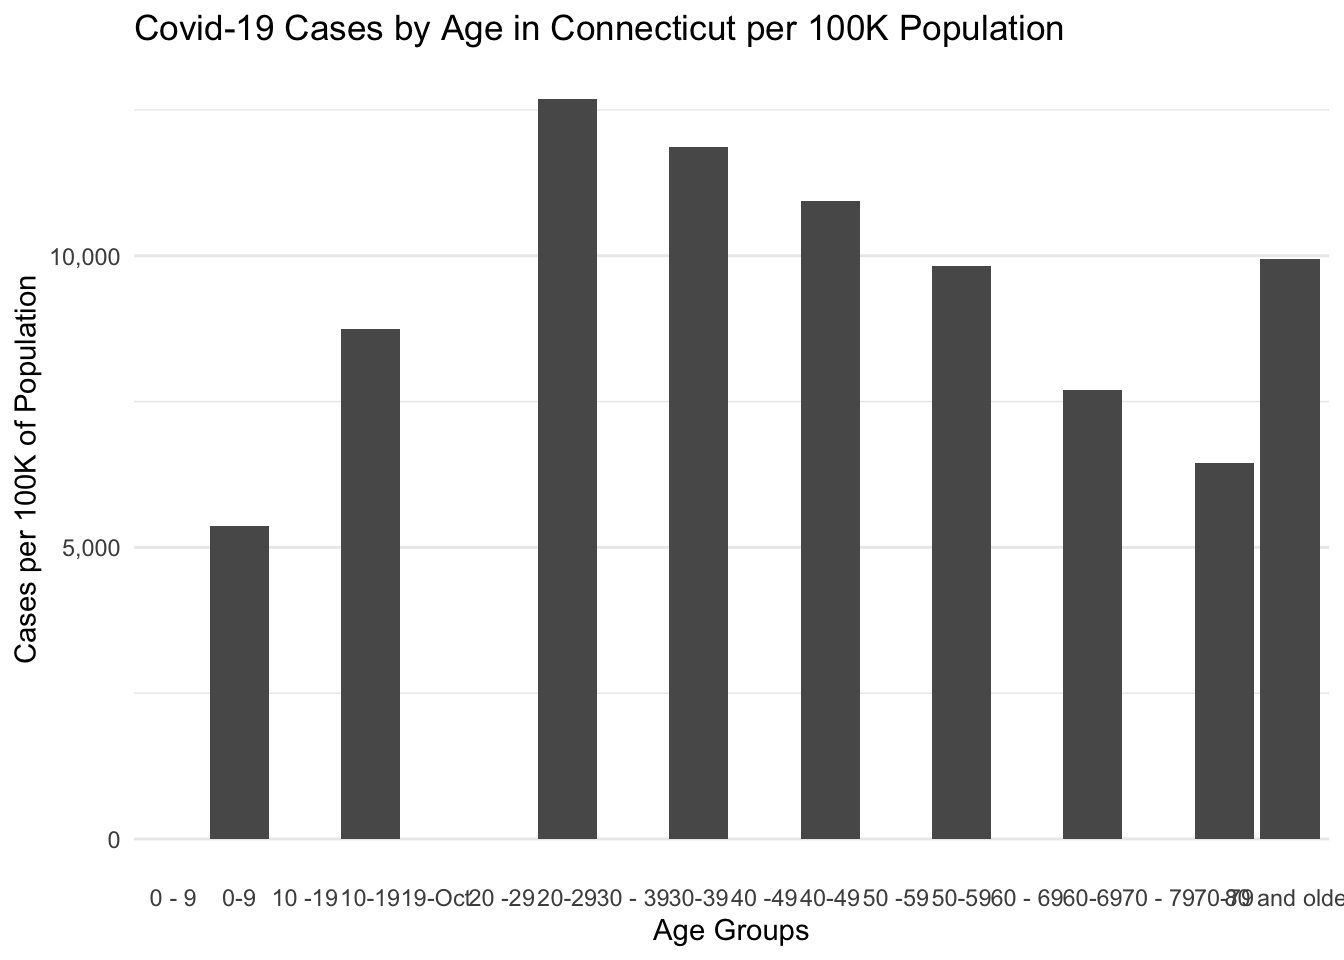
Figure 8: Covid-19 Cases by Age
Deaths increase with age, as has been well known since the beginning of the epidemic. For cases, the number of cases per population stays relatively flat from 20 to 79 and rises very rapidly for the oldest category. I haven’t examined this data closely, but I assume this pattern is related to the high rates of mortality in nursing homes. For the age range from 60 to 79 there probably are a lot of seniors who are going to a great deal of trouble avoiding places and situations where there is risk of catching the virus. But individuals in nursing homes don’t have that much control over their own lives. I would guess that the older population outside of nursing homes has a lower rate of catching the virus and the population inside nursing homes has a higher rate. The two trends may average out to a rate that is the same as middle aged adults. This is just speculation. I haven’t dug into the data to say anything firm about this
Nursing Homes
Nursing homes have been hard hit by the epidemic. It’s hard to control coronavirus outbreak in a group living situation, which includes prisons and cruises ship. On top of that, Covid-19 is especially serious for the elderly. The combination in nursing homes has been deadly. There have been 2,719 deaths in Connecticut Nursing Homes which makes 33.6% of the total of 8,084 deaths from Covid-19.
Prisons
Prisons even more than nursing homes create a situation where it is hard to limit exposure among individuals living together. We have less information about prisons than about nursing homes. The Department of Corrections (DOC) posts some statistics on total Covid19 rates among prisoners and staff via the state open data site and some limited information of rates by individual facility on their web site, but the data are not as detailed or as accessible as the data on nursing homes.
As of 04/29/2021, 4,463 inmates have tested positive for Covid-19. At the peak of the epidemic, 158 inmates were isolated at the Northern Correctional Institution medical facility. The most recent report is that 19 died, and currently NA Covid-19 inmates remain in that medical facility.
Unlike nursing homes, the number of deaths from Covid-19 in prisons is relatively low. Presumably that is because the prison population has many fewer elderly people who are especially vulnerable to the effects of Covid-19.
In addition to prisoners, the Department of Corrections reports that 1,643 staff have tested positive for Covid-19, of whom 1,618 have been cleared to return to work.
One cannot easily relate the number of cases reported by the Department of Corrections to the town by town counts reported by the Department of Public Health. It’s clear that for small rural towns the prison cases may swamp the community counts in those towns. For example, in the town of Brooklyn in Windham County (population about 8,200) the DPH town stats between June 17 and June 18 showed the number of cases jumped from 24 to 116. That’s the home of the Brooklyn Correctional Institution and I have to believe that site dominated those numbers and that the process by which the Department of Corrections reported test results to the Department of Public Health affected the magnitude of the one-day jump.
In effect there is a separate epidemic occurring inside the prison system and the pace of that epidemic does not necessarily correspond to trends in the wider community. For the purposes of tracking Covid-19 in the population of Connecticut generally, in some cases I will exclude some of the small rural towns with prisons such as Somers, Montville, and Brooklyn. But it’s not practical for me to segregate the effect of prisons on counts for larger towns such as New Haven, Cheshire, Hartford, and others. As of 6/16/2020, the DOC reported a cumulative total of 117 cases among prisoners in Bridgeport, 125 in New Haven, 94 in Hartford, and 21 in Cheshire. Enfield is a tricky case. There are two DOC facilities in Enfield and as of 6/16/2020 DOC reported 265 cases there. Enfield has a population of about 44,000, but the prison cases may have a significant effect on the picture of Covid-19 in Enfield. Similar to Brooklyn, one can see likely effects in the reports. On 6/10/20 DPH reported a total of 447 Covid-19 cases in Enfield and the next day on 6/11/2020 they reported 546, and increase of 22% in one day. That’s highly likely to be an effect of how cases were reported from the DOC facilities in Enfield and how those reports reached the Department of Public Health.
Variations by County in Connecticut
Next I’ll look at variations within Connecticut. Below are two maps showing the eight counties in Connecticut1. The first map in Figure 9 shows the cumulative total of cases since the start of the epidemic. The second map shows only new cases reporting during the last two weeks. On both maps, cases are adjusted to show cases per 100K of population. So the first map relates more to the total impact of the disease over the full course of the epidemic to date, and the second map is an indication of the recent prevalence of the virus.
Connecticut is part of the epidemic’s surge in the New York area and the magnitude of the epidemic has been greater in the counties closer to New York City. Back in March cases first appeared in Fairfield County and then spread to Litchfield, New Haven, and Hartford. More recently Hartford has been the area that we have to watch.
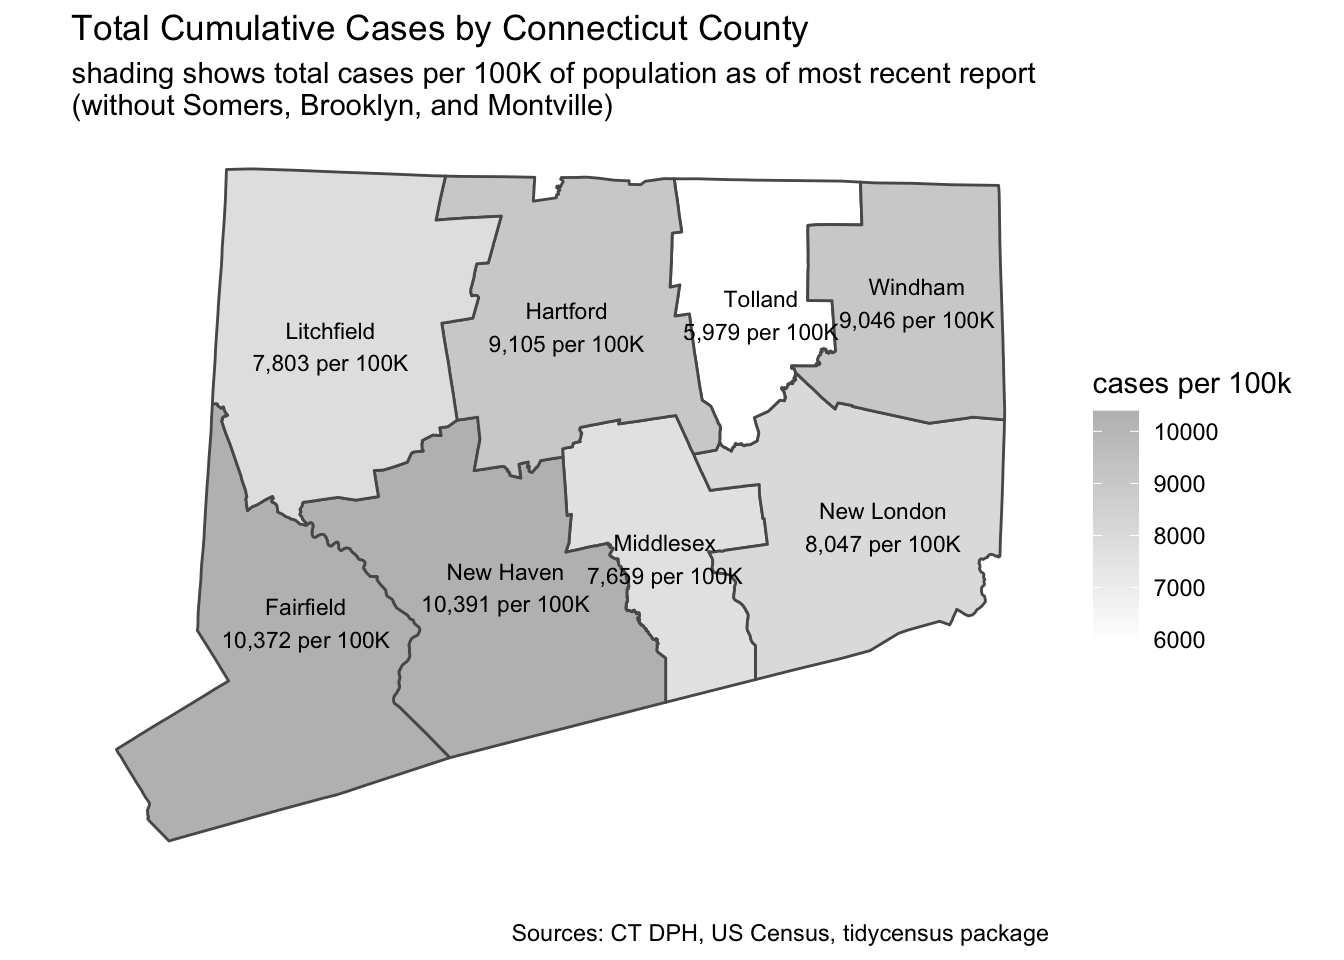
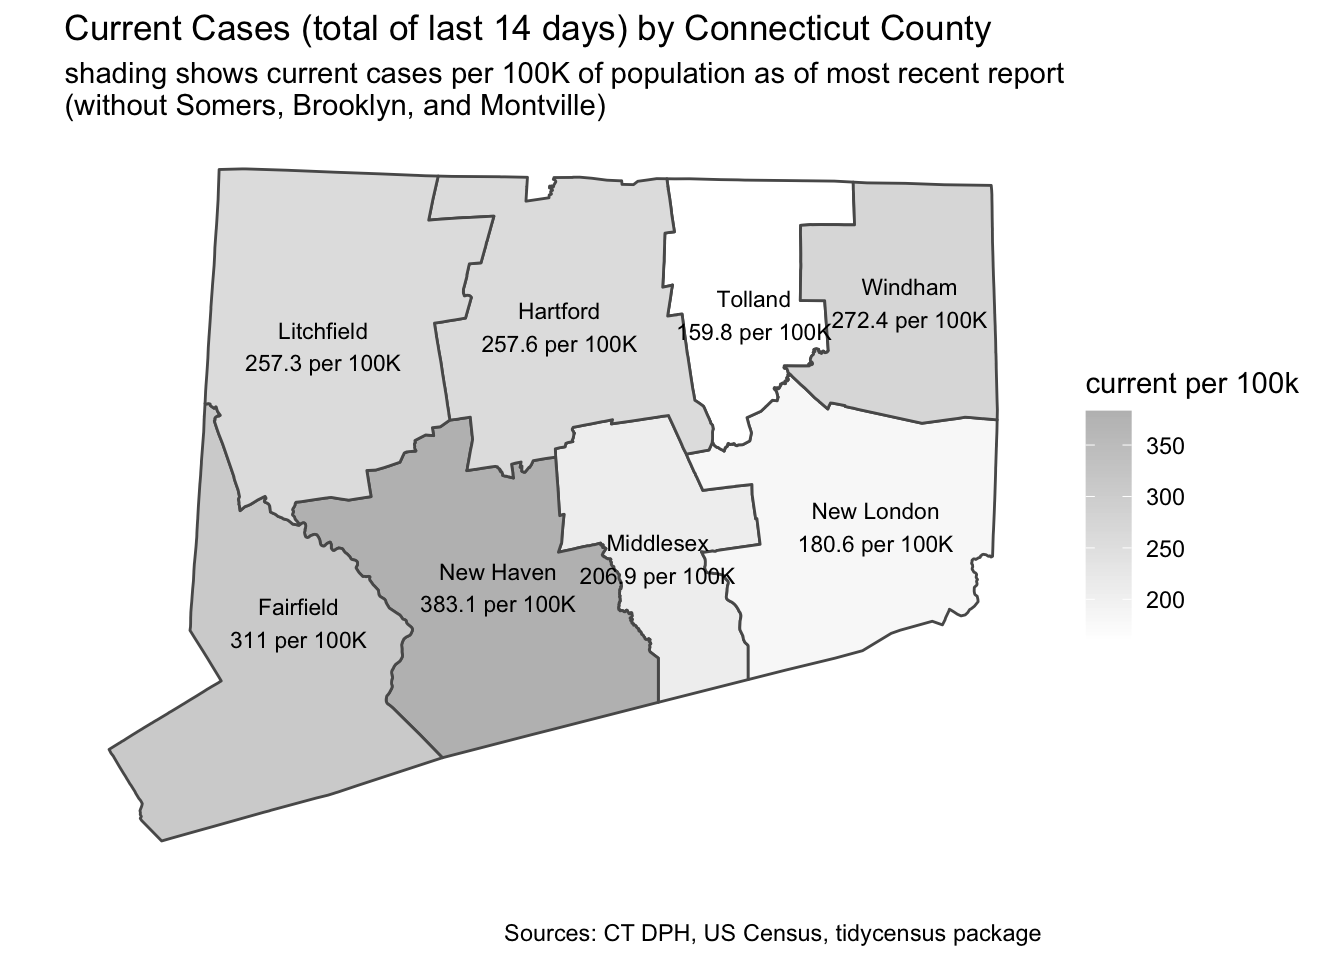
Figure 9: County Maps of New and of Cumulative Cases
By County and Type of Town
There are 169 towns in Connecticut, which makes it hard to examine variations by town. To help examine variations within counties, I’ll use a typology of towns called The Five Connecticuts that divides towns into five categories based on census variables: Urban Core, Urban Periphery, Suburban, Rural, and a fifth category for Wealthy Suburbs used for some towns in Fairfield County. Adjusting for population, the number of cases has been greater in the counties closer to New York City. In the figure below I’ll fold the wealthy towns into the Suburban category. I have excluded Montville and Somers because the prisons in those towns complicates interpretation of the town statistics.
Counties are laid out from top to bottom and the counties closer to New
York are toward the top. The columns show the four categories. Urban
towns have been hit harder than suburban and rural towns. While density
may have some effect on case rates, the report Towards Health Equity in
Connecticut: The Role of Social Inequality and the Impact of
COVID-19
by DataHaven documents how the epidemic interacts with existing social
inequality in Connecticut.
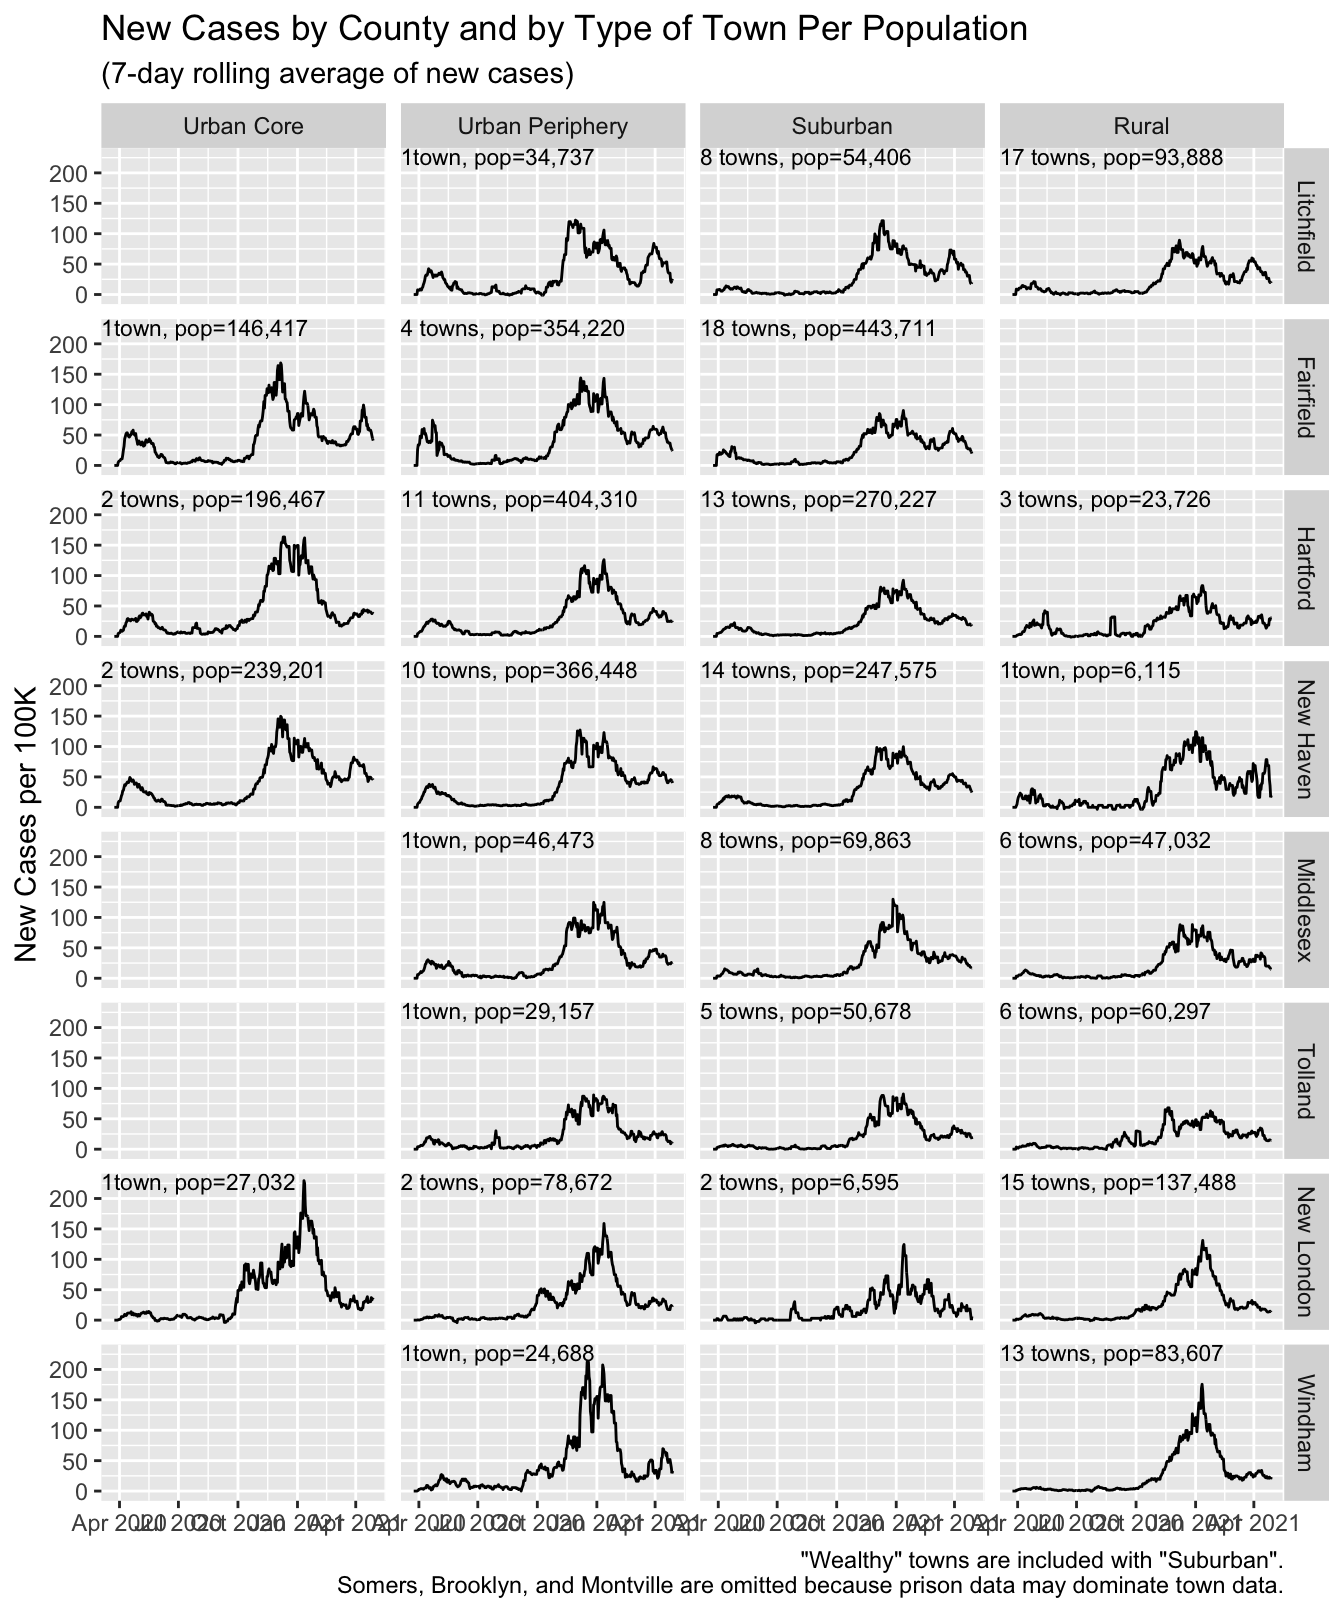
Figure 10: Cases by County
Details by Town
The links below take you to a separate HTML page for each Connecticut county. That page contains a table with one row for each town in the county.
For each town it shows the category, the population, the total number of cases to date, the number of recent cases per 100K of population (total new cases in the last two weeks), total deaths, and the percentage of total deaths in that town attributed to nursing home residents.
Next there are two sparklines that show the trend in daily new cases and daily deaths (based on 14 day moving average). Cases and deaths are shown as a ratio to population in the town.
The purpose of these tables is to make it easier to quickly scan for trends in local towns. Here is sample (based on my home of Guilford) showing what is available for each town.
For each county there is also a map showing the towns in that county and the relative number of total cases in the town and a second map that shows the percentage of individuals who are below the poverty line.
The town sparklines at the right show the trends over time. The vertical scale is different for new cases and for deaths. For new cases, the maximum height shown on the scale is 100 while for deaths, the maximum value shown is 23.7. For both new cases and deaths, the sparkline shows the rolling seven day average of new cases or deaths.
| town | category | total population | total cases | recent cases per 100K | total deaths | % deaths from nursing homes | town cases | town deaths |
|---|---|---|---|---|---|---|---|---|
| Guilford | Suburban | 22,285 | 1,417 | 215.4 | 33 | 82% |
Links to Summary Page for Each Connecticut County
Below are links to a separate web page by for each of the eight counties in Connecticut. Click on the county name for detail about individual towns within that county.
| Litchfield County | Hartford County | Tolland County | Windham County |
| Fairfield County | New Haven County | Middlesex County | New London County |
Where Do Things Stand Today?
As I write this on July 4, Connecticut seems to be in relatively good
shape. Covid ActNow shows it as one
of only three states “on track to contain COVID” along with
Massachusetts and Vermont.
It won’t be easy to sustain that situation. Some of our fellow
northeastern states have also done well but are struggling to maintain
their success.
I started burrowing into the Covid-19 data back in March in part because I’m a 70 year old male who therefore is at high risk (and because I love to work in R and I’m always looking for an excuse). The situation in Connecticut looks and feels very different than it did in March-April. One amazing feature of this epidemic is how differently it affects subsets of the population. As a financially comfortable semi-retiree, it was quite easy for me to hide from the virus by hiding from people in general. Many, many people were not so fortunate. If you can get out of the way of the virus, you do it. But if economic circumstances force you to work face to face or if you are confined to a group living situation or if where you live forces you to mingle with multiple generations and multiple networks of interactions, it is much harder to avoid the virus. I’m equally shocked by how the economic effects hit individuals in dramatically different ways. For someone in my circumstances there is almost no effect. Meanwhile many people face economic ruin that will affect them for the rest of their lives. The virus and its effects cannot be contained by uncoordinated individual efforts. It takes collective will and collective action. Many individuals are coping, but collectively we are failing.
It is tragic watching the virus explode in the south and southwest. New
York and others showed that you can get it back under control, but it
took a maximum concerted effort. There is no sign that going to happen
in many parts of the country.
Links to Sources
State of Connecticut Department of Public Health
- Daily Covid-19 Update in the form of a PDF. A list of the reports is available via Connecticut Open Data.
- Connecticut Covid-19 Data Tracker
- Links to all Covid-19 items available via Connecticut Open Data
The Connecticut Open Data site is a tremendous resource and I expect to use it for other projects in the future. The RSocrata package made it very easy to download this data. It’s run by Connecticut’s Chief Data Officer under the auspices of the Office of Policy and Management. They have produced a high-quality data portal.
Mapping and Covid-19 at the Yale Medical School I have had an opportunity to observe some of these efforts for me it has been a great source of information and inspiration.
DataHaven provides some Connecticut-focused information on Covid-19. They also published a report on how Covid-19 relates to existing inequalities in Connecticut.
CTData Collaborative also provides data on Covid-19 and its impact in Connecticut.
Connecticut COVID-19 Wastewater Project Report on test results on New Haven area sewage.
Yale SARS-CoV-2 Genomic Surveillance Initiative Genomic sequencing of some cases in Connecticut.
COVID Tracking Project The data for Figure 6 is from COVID Tracking Project and is used under a Creative Commons CC BY-NC-4.0 license.
For Rt I am using covidestim · COVID-19 nowcasting. I previously used rt.live, but they stopped doing estimates and referred me to Covid-19 nowcasting.
Covid ActNow I only learned about this project today, but it seems quite interesting.
CovidTrackCT uses genetic sequence mapping to trace what strains have they have seen in Connecticut. This shows connection to New York and continued local transmission within Connectiut.
Methodology and Notes
Code Used to Produce This Post
The R code used to download and process the data from Connecticut and elsewhere is in the file daily_ct_stats. This post was created using RMarkdown so the code to create most of the figures is in the .Rmd file for this post.
The separate HTML files for each Connecticut county were created using the rmarkdown::render function. The RMarkdown document that actually formatted the town details (including sparklines and county maps) is here.
Some noteworthy packages used here:
geofacet used to create the map of US states in Figures 5 and 6.
tidycensus used to create the Connecticut maps and retrieve Census data (most of which I didn’t use).
formattable – Used to create the town-by-town detail tables primarily because this was the only tool I found that would readily add a sparkline to a table.
Some Notes on the Data Available From the Department of Public Health
Sometimes there is a lag before cases and deaths end up in the daily reports. As a result, there tends to be a “day of the week” effect. For that reason, observers of the Covid-19 statistics generally focus on a 7-day rolling average of the daily counts. Some of the unusually large peaks and valleys in these charts are due to reporting process. The DPH has also begun producing reports based on the date a sample was taken for a test and by the date of death. That’s a more accurate way to look at the change over time, but it means the data for the most recent days are hard to interpret because some data may be “in process” and not yet reported. In these charts I have used “date of report” rather than “date of sample taken” or “date of death” because that gives me all of the recent data that is available and because that is what most other data projects (such as the COVID Tracking Project or the New York Times) have been using.
The DPH reports always include a comment that “all data are preliminary and subject to change.” But when they make and adjustment to correct errors, as far as I can tell they do not go back and adjust the earlier reports. That can lead to a misleading report of recent changes. For example, in one note below they removed 70 cases because of errors on a day in which there were 81 new cases. In the data series that I download, that shows up as having been 11 new cases that day, not 81, because 70 were removed. Earlier days are not corrected.
*In Connecticut during the early months of this pandemic, it became increasingly clear that it would be necessary to track probable COVID-19 cases and deaths, in addition to laboratory-confirmed (RT- PCR) cases and deaths. This was needed to better measure the burden and impact of this disease in our communities and is now part of the national surveillance case definition for COVID-19. Today for the first time, DPH is reporting cases and deaths as “confirmed” or “probable.” Previous reports reported these as a combined number. The only change today is that they are being separated to conform with CDC reporting guidance. Probable cases of COVID-19 involve persons who have not had confirmatory laboratory testing (RT-PCR) performed for COVID-19, but whose symptoms indicate they are very likely to have a COVID-19 infection. In Connecticut, most of the probable COVID-19 cases involve persons whose death certificates list COVID-19 disease or SARS-CoV-2 as a cause of death or a significant condition contributing to death.
The staff at the Department of Public Health have removed 356 cases and 808 tests in the past 24 hours, which were identified as duplicates in the system, affecting both test and overall case numbers. Since yesterday, there have been 341 new positive cases, and 5,215 new tests were reported.
Please note that 81 new cases were reported in the past 24-hours; 70 previously reported cases were removed from the total counts due to correction of data errors.
In the data portal, the number of cases reported for Montville was 381 on June 17. As of June 18 it reports 293 cases, a reduction of 88 cases. That’s more than the 70 cases removed. Perhaps the case counts for Montville were affected by inmates being moved within the Connecticut prison system.
1175 new test results were reported since the last report and 2770 previously reported PCR tests were removed due to correction of data errors.
*Please note 83 new cases were reported to DPH since yesterday. In addition, 74 previously reported cases were removed due to updated laboratory findings of false positive results.
July 24, 2020: Governor’s press release
*NOTE: Today’s update includes a large set of data provided by an out-of-state lab on tests that were conducted on Connecticut residents between May 23 and July 20 and not reported to the State of Connecticut until today. This data set provided by the out-of-state lab includes approximately 12,000 tests, 440 of which were positive. The remaining 104 positive cases in today’s report are newly reported cases in the day-to-day update, giving a 0.79% positivity rate for the day.
See also Hartford Courant, July 24, 2020 I don’t see any explanation of this in the Department of Public Health PDF, but it was clear that an increase of 544 cases in one day would be remarkable.
On Friday, the state also announced a backlog of unreported test results for Connecticut residents dating back to mid-May. Among these approximately 12,000 tests, 440 were positive. On Thursday, the state reported an additional 13,000 tests. With the 544 new cases, the state has now recorded 48,776 coronavirus cases.
*In addition to the 79 recently diagnosed cases and 12,367 tests, 384 cases and 750 tests performed between April and June were newly reported to the Department of Public Health in connection with a transition to electronic reporting by an out-of-state regional laboratory. For surveillance purposes, that data has been added to the total case and total test counts.
Note as of August 18, 2020 DPH daily update:
*Forty new cases were reported to CT DPH since yesterday; in addition, DPH removed 52 previously reported cases because of newly identified data errors.
As of Monday, there were additional 1,066 positive cases from Friday. That included over 270 positive cases out of 23,130 tests conducted between September 26 and October 8 that are newly reported as part of catch-up reporting.
The data displayed on these maps excludes the towns of Somers, Brooklyn, and Montville because they are small rural towns with prisons, and the cases reported in the prisons may dominate the total in the town and even affect the reporting for the county overall. Covid-19 in prisons is a significant issue, but it’s helpful to try to evaluate it separately from data from the non-prison community.↩︎